Benchmarking Guide
Walrus ships with comprehensive benchmarking tools to measure write throughput, read performance, and thread scaling characteristics. This guide explains how to run the benchmarks, interpret results, and tune for your workload.
Table of Contents
- Benchmarking Guide
Quick Start
The fastest way to see Walrus’s performance:
# Run all benchmarks and generate graphs
pip install pandas matplotlib
make bench-and-show-reads
This runs read benchmarks and opens performance graphs in your browser.
Available Benchmarks
Write Throughput
Measures sustained write operations per second:
make bench-writes
What it tests:
- Single-threaded append performance
- Multi-threaded scaling (default: 1, 2, 4, 8 threads)
- Different fsync schedules
- Entry sizes (configurable)
Output:
CSV: benchmarks/write_benchmark_<timestamp>.csv
Columns: threads, fsync_mode, ops_per_sec, mb_per_sec, avg_latency_us
Typical results (consumer laptop, 8 cores, NVMe SSD):
- 1 thread: ~200-300k ops/sec
- 8 threads: ~1M ops/sec
- 16 threads: ~1.5M ops/sec (disk-bound)
Read Throughput
Measures read performance after a write phase:
make bench-reads
What it tests:
- Write phase: populate WAL with data
- Read phase: measure read throughput
- Different consistency modes (StrictlyAtOnce, AtLeastOnce)
- Batch read performance
Output:
CSV: benchmarks/read_benchmark_<timestamp>.csv
Columns: phase, threads, ops_per_sec, mb_per_sec, avg_latency_us
Typical results:
- Batch reads: ~800 MB/sec (single thread)
- Single reads: ~500k ops/sec (8 threads)
Thread Scaling
Sweeps thread counts to find scaling characteristics:
make bench-scaling
What it tests:
- Write throughput from 1 to N threads
- Identifies bottlenecks (disk bandwidth, lock contention)
- Helps determine optimal thread count for your hardware
Output:
CSV: benchmarks/scaling_benchmark_<timestamp>.csv
Columns: threads, ops_per_sec, mb_per_sec, cpu_usage
Interpreting the graph:
- Linear scaling: system is efficient
- Plateau: disk bandwidth saturated
- Decline: lock contention or cache thrashing
Environment Variables
Customize benchmarks without modifying code:
| Variable | Description | Example |
|---|---|---|
FSYNC / WALRUS_FSYNC | Fsync schedule | sync-each, no-fsync, async, 500ms |
THREADS / WALRUS_THREADS | Thread count or range | 8 or 1-16 |
WALRUS_DURATION | Benchmark duration | 30s, 2m, 1h |
WALRUS_WRITE_DURATION | Write phase duration (read bench) | 1m |
WALRUS_READ_DURATION | Read phase duration (read bench) | 30s |
WALRUS_BATCH_SIZE / BATCH | Entries per batch | 100, 1000, 2000 |
ENTRY_SIZE | Entry size in bytes | 1024, 10240 |
WALRUS_DATA_DIR | Data directory | /mnt/nvme/wal |
WALRUS_QUIET | Suppress debug logs | 1 |
Examples
Maximum throughput (no durability):
FSYNC=no-fsync THREADS=16 WALRUS_DURATION=1m make bench-writes
Production-like (balanced):
FSYNC=1000ms THREADS=8 WALRUS_DURATION=5m make bench-writes
Maximum durability (slow):
FSYNC=sync-each THREADS=1 WALRUS_DURATION=30s make bench-writes
Thread sweep:
THREADS=1-16 WALRUS_DURATION=1m make bench-scaling
Large entries:
ENTRY_SIZE=1048576 THREADS=8 make bench-writes # 1 MB entries
Interpreting Results
Write Benchmark Output
threads,fsync_mode,ops_per_sec,mb_per_sec,avg_latency_us
1,no-fsync,245123,234.5,4.08
8,no-fsync,1023456,976.3,7.82
8,1000ms,892345,851.2,8.97
8,sync-each,12543,12.0,637.45
Key metrics:
ops_per_sec:
- Operations (appends) per second
- Higher is better
- Compare across thread counts to see scaling
mb_per_sec:
- Megabytes written per second
- Should saturate disk bandwidth at high thread counts
- Consumer NVMe: ~1-3 GB/sec
- Consumer SATA SSD: ~500 MB/sec
avg_latency_us:
- Average append latency in microseconds
- Lower is better
- Should stay <10 μs for no-fsync
- Increases with fsync (200-1000 μs typical)
Read Benchmark Output
phase,threads,ops_per_sec,mb_per_sec,avg_latency_us
write,8,1023456,976.3,7.82
read,1,523456,499.2,1.91
read,8,1234567,1177.3,6.48
Phases:
write: Populate phase (ignore unless debugging)read: Read performance (this is what matters)
What to look for:
- Read throughput > write throughput (reads are faster)
- mb_per_sec should saturate disk read bandwidth
- Batch reads should show higher MB/sec than single reads
Scaling Benchmark Graph
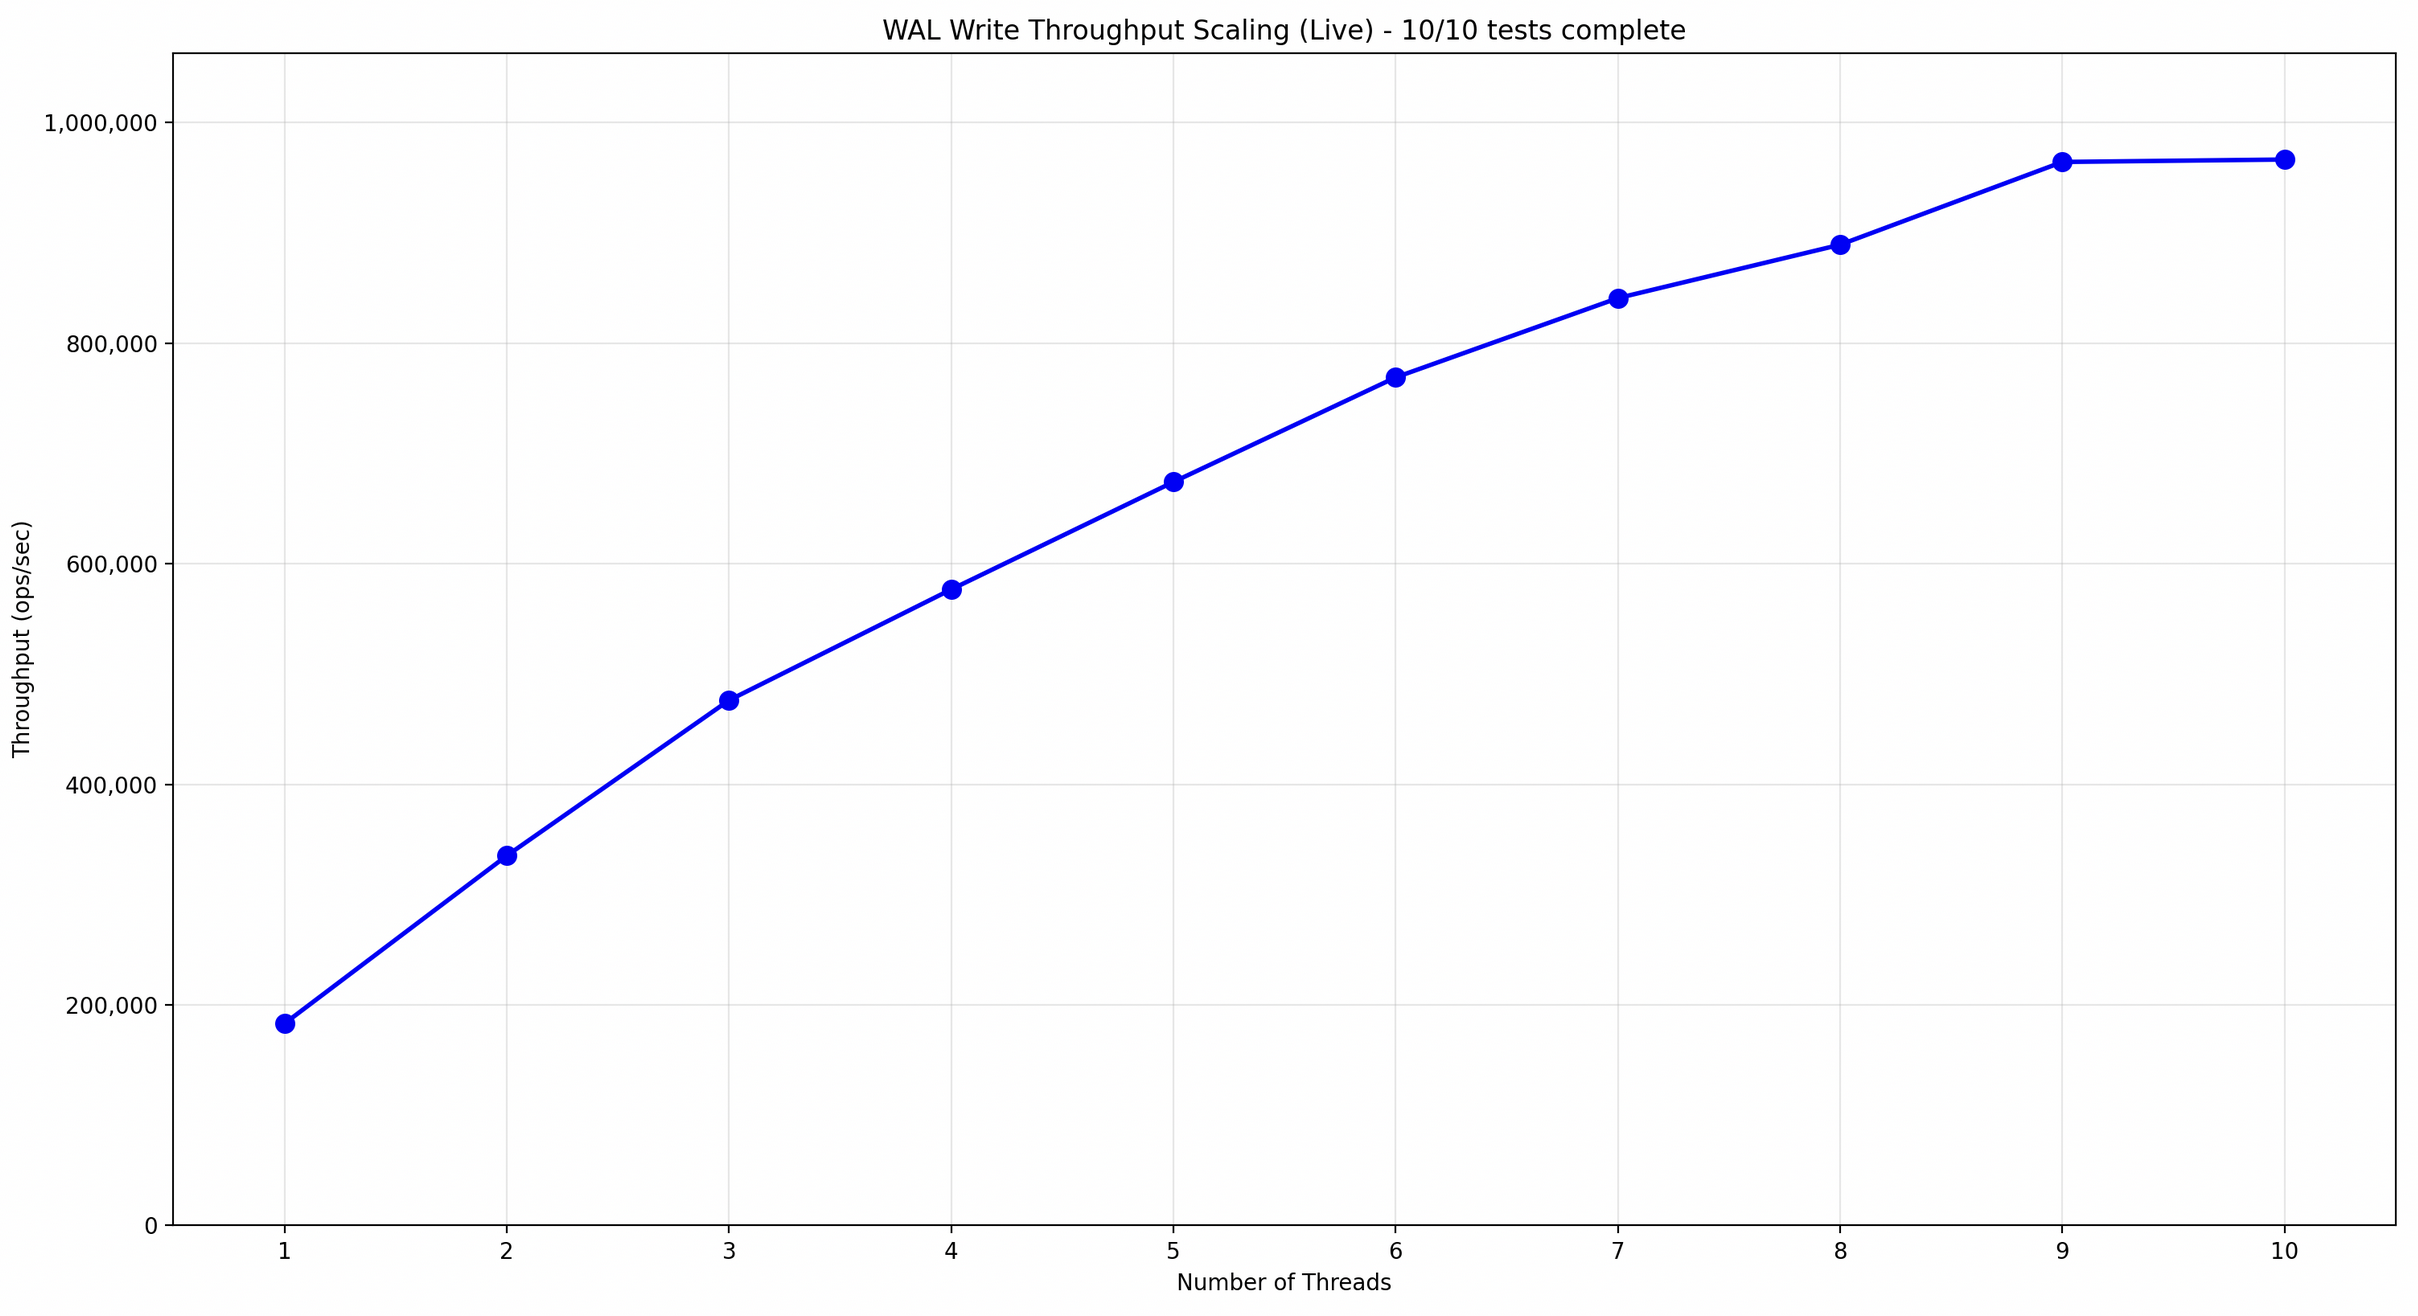
Interpretation:
Linear region (1-8 threads):
- System is scaling efficiently
- CPU and locks aren’t bottleneck
- Keep adding threads
Plateau region (8-16 threads):
- Disk bandwidth saturated
- Adding threads doesn’t help
- This is your optimal thread count
Decline region (16+ threads):
- Lock contention or cache thrashing
- Too many threads, reduce to plateau point
Visualizing Results
Generate Graphs
# After running benchmarks
make show-writes   # Visualize write benchmark
make show-reads    # Visualize read benchmark
make show-scaling  # Visualize scaling benchmark
Requirements:
pip install pandas matplotlib
Output: Opens browser with interactive graphs showing:
- Throughput vs threads
- Latency distributions
- Fsync impact
- Bandwidth utilization
Custom Analysis
CSV files are in benchmarks/:
import pandas as pd
import matplotlib.pyplot as plt

# Load data
df = pd.read_csv('benchmarks/write_benchmark_<timestamp>.csv')

# Plot ops/sec vs threads for each fsync mode
for mode in df['fsync_mode'].unique():
    subset = df[df['fsync_mode'] == mode]
    plt.plot(subset['threads'], subset['ops_per_sec'], label=mode)

plt.xlabel('Threads')
plt.ylabel('Operations/sec')
plt.legend()
plt.show()
Hardware-Specific Tuning
Consumer SATA SSD
Characteristics:
- ~500 MB/sec sequential write
- ~50k IOPS random write
- High fsync latency (1-5 ms)
Recommended settings:
FSYNC=2000ms THREADS=4 make bench-writes
Expected:
- ~300-500k ops/sec (small entries)
- ~400-500 MB/sec (large entries)
Consumer NVMe SSD
Characteristics:
- ~2-3 GB/sec sequential write
- ~200k IOPS random write
- Low fsync latency (200-500 μs)
Recommended settings:
FSYNC=1000ms THREADS=8-16 make bench-writes
Expected:
- ~1-1.5M ops/sec (small entries)
- ~1-2 GB/sec (large entries)
Enterprise NVMe (Intel Optane, Samsung PM1733)
Characteristics:
- ~5-7 GB/sec sequential write
- ~1M IOPS random write
- Ultra-low fsync latency (<100 μs)
Recommended settings:
FSYNC=async THREADS=32 make bench-writes
Expected:
- ~3-5M ops/sec (small entries)
- ~5+ GB/sec (large entries)
Spinning Disk (HDD)
Not recommended for Walrus.
If you must:
FSYNC=5000ms THREADS=1 make bench-writes
Expected:
- ~5-10k ops/sec (sequential only)
- ~100-150 MB/sec
Why slow: Seek time kills random I/O. Use SSD.
Profiling for Performance Issues
Linux: perf
# Record benchmark
perf record -g ./target/release/write_benchmark

# Analyze
perf report

# Look for hot spots:
# - checksum64(): should be <5% CPU
# - allocator spin lock: should be <2% CPU
# - write syscalls: should be rare with mmap
macOS: Instruments
# Profile with Time Profiler
instruments -t "Time Profiler" ./target/release/write_benchmark

# Look for:
# - Excessive lock contention
# - Syscall overhead
# - Memory allocation in hot path
Flamegraph
# Install flamegraph
cargo install flamegraph

# Generate flamegraph
cargo flamegraph --bench write_benchmark

# Opens flamegraph.svg in browser
What to look for:
- Wide bars: hot functions (expected: write, checksum)
- Deep stacks: potential optimization targets
- Syscalls: should be minimal (mmap + io_uring)
Comparing Configurations
Fsync Impact
# Run with different fsync modes
FSYNC=no-fsync THREADS=8 make bench-writes
FSYNC=1000ms THREADS=8 make bench-writes
FSYNC=sync-each THREADS=8 make bench-writes

# Compare CSV outputs
Expected results:
| Fsync Mode | Ops/sec | Latency (μs) | Durability |
|---|---|---|---|
| no-fsync | 1M | 5-10 | None |
| 1000ms | 800k | 10-15 | 1s window |
| sync-each | 10k | 500-1000 | Immediate |
Tradeoff: 100x throughput loss for immediate durability.
Backend Impact (Linux)
# Mmap backend
BACKEND=mmap THREADS=8 make bench-writes

# FD backend (io_uring)
BACKEND=fd THREADS=8 make bench-writes

# Compare results
Expected: FD backend ~20-30% faster for batch operations.
Real-World Scenarios
Scenario 1: High-Throughput Analytics
Workload:
- 1M events/sec
- 1 KB average entry size
- 1 hour retention
- Can tolerate 5-second data loss
Configuration:
let wal = Walrus::with_consistency_and_schedule(
    ReadConsistency::AtLeastOnce { persist_every: 10_000 },
    FsyncSchedule::Milliseconds(5_000),
)?;
Benchmark:
FSYNC=5000ms THREADS=16 ENTRY_SIZE=1024 WALRUS_DURATION=10m make bench-writes
Expected:
- ~1-1.5M ops/sec (meets requirement)
- ~1-1.5 GB/sec (disk should handle)
Scenario 2: Financial Transactions
Workload:
- 10k transactions/sec
- 512 bytes average
- Zero data loss tolerance
Configuration:
let wal = Walrus::with_consistency_and_schedule(
    ReadConsistency::StrictlyAtOnce,
    FsyncSchedule::SyncEach,
)?;
Benchmark:
FSYNC=sync-each THREADS=4 ENTRY_SIZE=512 make bench-writes
Expected:
- ~10-50k ops/sec (depends on disk fsync latency)
- Meets requirement if disk supports <100 μs fsync
Scenario 3: Message Queue
Workload:
- 100k messages/sec
- 10 KB average
- 1-second durability window acceptable
Configuration:
let wal = Walrus::with_consistency_and_schedule(
    ReadConsistency::AtLeastOnce { persist_every: 1_000 },
    FsyncSchedule::Milliseconds(1_000),
)?;
Benchmark:
FSYNC=1000ms THREADS=8 ENTRY_SIZE=10240 make bench-writes
Expected:
- ~500k-800k ops/sec (exceeds requirement)
- ~5-8 GB/sec (need fast NVMe)
Troubleshooting Benchmark Issues
Low Throughput
Symptom: ops/sec much lower than expected.
Checklist:
- Check backend: Should use FD on Linux
WALRUS_QUIET=0 ./benchmark # Should say "FD backend" - Check disk utilization:
iostat -x 1 # Run during benchmark # %util should be 90-100% if disk-bound - Check CPU usage:
top # Run during benchmark # Should see high CPU if not disk-bound - Profile for locks:
perf record -g ./benchmark
perf report  # Look for spin_loop or mutex overhead
High Latency
Symptom: avg_latency_us > 50 μs with no-fsync.
Possible causes:
- Disk slow (check
iostat) - Memory pressure (check
free -m) - Lock contention (profile with
perf)
Fix:
# Try fewer threads
THREADS=4 make bench-writes

# Try larger entries (amortize overhead)
ENTRY_SIZE=10240 make bench-writes
Inconsistent Results
Symptom: Results vary wildly between runs.
Possible causes:
- Background processes (OS updates, backups)
- Thermal throttling
- Shared disk (other processes writing)
Fix:
# Stop background services
systemctl stop unnecessary-service

# Longer duration (average out variance)
WALRUS_DURATION=10m make bench-writes

# Run multiple times, take median
for i in {1..5}; do make bench-writes; done
Best Practices
- Clear WAL between runs:
rm -rf wal_files/* - Warm up disk: Run short benchmark before timed run
- Consistent environment: Same disk, same OS load, same background activity
- Multiple runs: Take median of 3-5 runs
- Document setup: Record CPU, disk, OS, Walrus version
- Compare fairly: Same hardware, same settings for all tools
Sharing Results
If you publish benchmark results:
Include:
- Hardware (CPU model, disk model, RAM)
- OS and kernel version
- Walrus version
- Configuration (fsync, consistency, threads)
- Raw CSV data (if possible)
Example:
Walrus v0.1.0 Write Benchmark
Hardware: AMD Ryzen 7 5800X, Samsung 980 Pro NVMe, 32 GB DDR4
OS: Ubuntu 22.04, kernel 5.15.0
Config: AtLeastOnce{10000}, Milliseconds(1000), 8 threads
Results: 1.2M ops/sec, 1.14 GB/sec, avg latency 6.7 μs
This helps others reproduce and validate your findings.